
Student preparation
Mariam Kareem
Student preparation
Zeina Fahd Al Ali
Tour of the Electromagnetic Spectrum
X-Rays:
- X-rays or X-rays are electromagnetic radiation with a wavelength ranging from 10 picometers to 10 nanometers, which correspond to frequencies between 30 petahertz to 30 exahertz (30×1015 Hz to 30×1018 Hz), and energy ranging from 124 electron volts to 124 kiloelectron volts.
- X-rays are widely used in radiography and in many technical and scientific fields.
- It was discovered by the German scientist Wilhelm Röntgen in 1895 at the University of Würzburg, and he won the Nobel Prize in Physics for it in 1901.
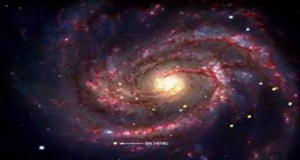
This mosaic of several Chandra X-ray Observatory images of the central region of our Milky Way galaxy reveals hundreds of white dwarf stars, neutron stars, and black holes. Separately, the Solar and Heliophysics Observatory (SOHO) captured these images of the Sun representing an entire solar cycle from 1996 through 2006.
Credit: NASA/UMass/D.Wang et al. Sun images from SOHO -EIT Consortium: NASA/ESA
DISCOVERY OF X-RAYS:
X-rays were first observed and documented in 1895 by German scientist Wilhelm Conrad Roentgen. He discovered that firing streams of x-rays through arms and hands created detailed images of the bones inside. When you get an x-ray taken, x-ray sensitive film is put on one side of your body, and x-rays are shot through you. Because bones are dense and absorb more x-rays than skin does, shadows of the bones are left on the x-ray film while the skin appears transparent.
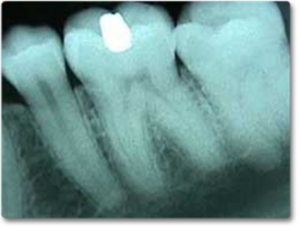
An X-ray photo of a one-year-old girl who swallowed a sewing pin, can you find it?

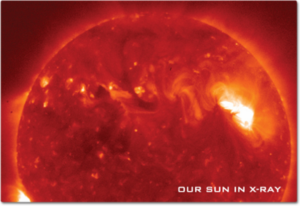
Our Sun’s radiation peaks in the visual range, but the Sun’s corona is much hotter and radiates mostly x-rays. To study the corona, scientists use data collected by x-ray detectors on satellites in orbit around the Earth. Japan’s Hinode spacecraft produced these x-ray images of the Sun that allow scientists to see and record the energy flows within the corona.
SUPERNOVA:
Since Earth’s atmosphere blocks x-ray radiation, telescopes with x-ray detectors must be positioned above Earth’s absorbing atmosphere. The supernova remnant Cassiopeia A (Cas A) was imaged by three of NASA’s great observatories, and data from all three observatories were used to create the image shown below. Infrared data from the Spitzer Space Telescope are colored red, optical data from the Hubble Space Telescope are yellow, and x-ray data from the Chandra X-ray Observatory are green and blue.
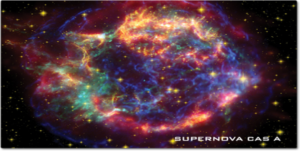
The x-ray data reveal hot gases at about ten million degrees Celsius that were created when ejected material from the supernova smashed into surrounding gas and dust at speeds of about ten million miles per hour. By comparing infrared and x-ray images, astronomers are learning more about how relatively cool dust grains can coexist within the super-hot, x-ray producing gas.